DMI is one of the simple indicator tools and is used for many different purposes. In my opinion, one of the indicators is simple but very effective.
In this article, I will introduce & guide how to use DMI in a simple way.
DMI – Directional Movement is an indicator developed by Dr. J. Welles Wilders in 1978.
DMI is in fact a collection of three separate indicators combined into one. Motion Orientation includes: Medium Orientation Index (ADX), Positive Orientation Indicator (+ DI) and Negative Orientation Indicator (-DI).
Inside:
The Directional Average (ADX) helps traders determine the strength of a trend. The indicator ranges from 0 to 100 with a high price, indicating a strong uptrend and a low price, indicating a weak trend.
And + DI and -DI are used to identify trends.
DMI is used for many different purposes such as: Identifying the strength and weakness of a trend, identifying trading signals.
Determine the strength of a trend with DMI
To determine the strength of a brother trend, you just need to use the indicator's ADX line. You can turn off 2 lines + DI and -DI to help tangle.

This is the custom interface of the indicator on Tradingview, you just need to turn off 2 lines + DI and -DI and highlight the ADX line.
ADX will fluctuate in the range of 0 – 100. The further the ADX goes to 100, the more likely it is that the price of Trend is on the trend.
Here ADX indicator only tells us whether there is a Trend or not, not to say whether a Trend is up or down, so you should pay attention to this point.
ADX = 80, the price has a strong Trend, be it the Trend of the increase or the Trend of decrease.
- ADX> 25, the price tends to (Trending)
- ADX <25, the price has no clear trend (Not Trending)
- If the ADX cuts 25, either up or down, it is a signal of an end to the trend.
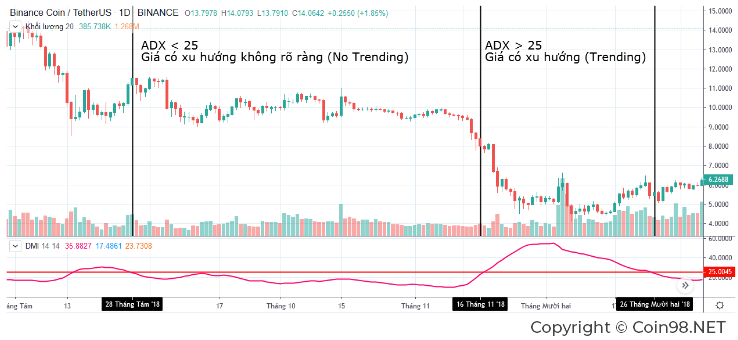
As you can see on the picture, you can see that the daily chart of BNB / USDT. After customizing the Indicator, we have as shown.
Analysis of graphs:
- You notice the time that ADX it cut down to 25, the price starts Sideway with no amplitude is too large (no Trending).
- As for the period when ADX slope up and cut past 25, BNB price will start to trend. The price range fluctuated during that time to more than 50%, a fairly large number for a Coin Top.
So, how can you trade with ADX if the price is trending and not the trend is strong or weak?
Here I will introduce you a method of trading between ADX and BB.
Transaction method between ADX and BB
This is a trading strategy for traders on the D1 time frame based on the Bollinger Bands indicator and the ADX line. This trading strategy is quite simple and easy to use.
The trading strategy will work effectively when the market is sideways (sideways or Not Trending).
What you should note with this trading strategy is to use the Bollinger Bands indicator with default settings and the ADX line, the time frame is D1.
Maybe you are interested in: What is Bollinger Band? How to use Bollinger Band in trading
The principle of dealing with this method is also very simple.
- You buy when ADX <25 and the price reaches the lower band of BB, taking profits when the price approaches the middle axis of MA20.
- You enter the sell order when ADX <25 and the price reach the upper band of BB, take profit when the price approaches the middle axis of MA20.
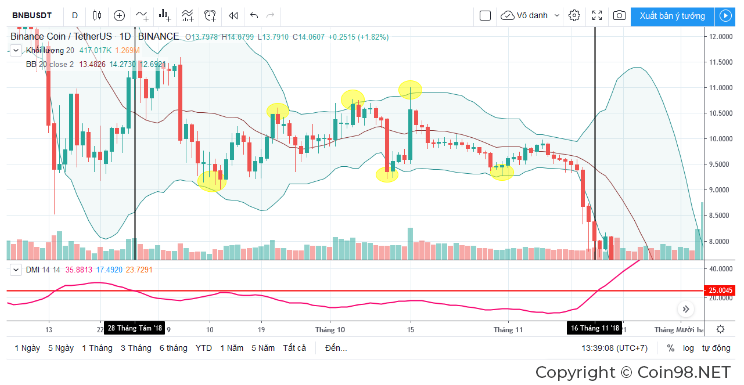
As you can see from the above buying and selling rules, the yellow price areas on the Chart are favorable areas for trading.
Note:
This is a fairly simple trading strategy. The point is that you need to be aware of the sideways price ranges for us to trade. This means that this strategy will not work when the market is trending or fluctuating sharply in one direction.
DMI transaction method
In addition to the above trading strategy, I will introduce to you another way of trading with DMI.
As I mentioned above, the DMI indicator is made up of 3 different lines: ADX, + DI & -DI. If you already know how to use ADX, I will tell you more about + DI and -DI:
- If ADX tells us whether the trend is strong or weak, the intersection of + DI and -DI will tell us whether the trend is up or down.
- + DI above -DI, the price tends to increase, -DI is above + DI, the price tends to decrease.
- Specifically, + DI cuts -DI, the price tends to change from decreasing to increasing, + DI cutting down -DI, the price tends to move from up to down.
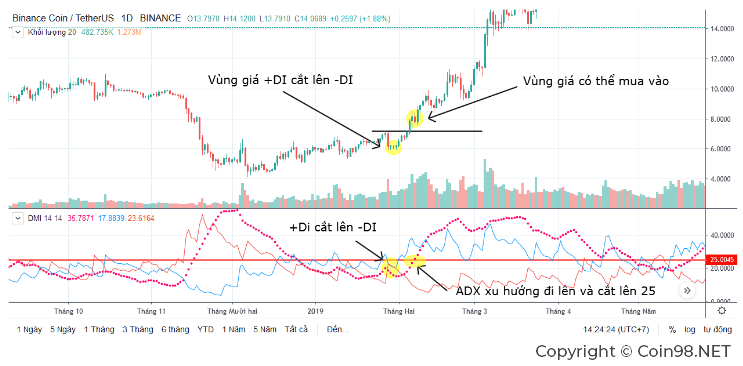
You observe the Daily Chart of BNB / USDT.
Graph analysis
After the integration is complete, the Chart looks like this:
- Notice that the yellow area I marked is when + DI cut -DI signals us that the price may tend to change from a downtrend to a rise.
- But do not rush to buy because ADX is always below 20, meaning that the trend is not clear (Non Trending) although the + DI signal cut -DI gives us the uptrend signal, but ADX tells us that This trend is not currently strong and can be reversed at any time.
- You wait to see if ADX is going to slope up and cut 25 or not, you can go easy.
- If you apply more knowledge of support – resistance, we will know that once resistance is broken, it can become support for prices.
- As shown in the figure, the price broke a resistance level created by the peak of the previous price and the price returned to Test support but failed to penetrate the support level.
Combining the facts we can enter a BUY command.
- + DI cuts up -DI, telling us the price is on an upward trend.
- ADX going from the bottom of a slope tends to change from Non Trending to Trending or in other words is telling us that the uptrend has increased strength.
- Price broke previous resistance and Test but did not penetrate that price area.
Note:
- A few notes for you that the DMI tool is also an indicator of latency, so it should be used to trade according to the Trend (Follow Trend).
- To achieve the best performance, you should combine with other tools such as BB or resistance support theory or diverging signals from Indicators such as RSI good Stoch.
Maybe you are interested in: What is RSI? Formula for calculating and using RSI in transactions
summary
So I have completed instructions for you to apply DMI in transactions.
If you have any questions, don't hesitate to leave a comment below the article. Me and the team Coin98 will answer you as soon as possible.
And now…
Hello and see you again in the next article!